
Nov 04, 2026 by Anthony York (YorkSoft Ltd)
Quick Summary
Measure technical SEO success with custom dashboards by first defining the business outcomes they must prove, then tracking indexation, crawl errors and Core Web Vitals by page template alongside enquiries or sales. Set alerts for sudden regressions and review the dashboard regularly, so fixes can be linked to real results.
Last Updated: 3 November 2026
Standard SEO reports tell you where your rankings sit. They rarely tell you why a page that should rank does not. Most generic reports bundle traffic, keyword positions and backlinks into one neat summary, and technical faults get buried underneath.
That gap matters. A custom dashboard built around technical signals shows indexation gaps, crawl errors and slow pages before they drain your organic traffic. YorkSoft Ltd, based in Northampton, offers SEO monitoring and custom web applications for businesses that need technical data they can act on.
The biggest blind spot is the link between a fix and an outcome. A report may show that organic traffic dipped, but it rarely shows that a blocked section of the site caused the drop. Custom dashboards can help connect a specific technical fix to user engagement and business results.
Before you add a single metric, decide what the dashboard has to prove. Start with the business question, then work backwards to the data.
Most teams track the wrong things first. Business-linked measures are more useful than vanity figures. Useful outcome measures include:
Write your outcomes down in one sentence each. For example: "Organic enquiries rise by 15% in six months." A dashboard without a stated outcome becomes a wall of charts that nobody reads.
Ask one more question: who will read this? A managing director wants revenue and CAC. A technical lead wants crawl errors and Core Web Vitals. Build separate views for each, or the dashboard will satisfy neither.
Once the outcomes are clear, pick the technical metrics that feed them. Measure fewer things well. Here is a short list of the core areas:
The sections below cover the two areas that most often hide problems.
Indexation is the first thing to check. A page that search engines cannot index cannot rank, however good the content is. Technical SEO dashboards are used to monitor indexation problems and detect blocks, so this is where your dashboard should start. Our technical SEO audit guide explains how to structure these checks as a repeatable workflow.
Track these items at minimum:
A sharp fall in indexed pages after a release is usually a technical fault, not a content problem. Set your dashboard to flag it the same day.
Core Web Vitals measure how quickly a page loads, how stable it is while loading, and how soon it responds to input (Web Vitals | Articles). These are the page-experience signals you can measure directly and fix in code.
Track three figures for your most important templates:
Measure by page template rather than page by page. A slow product template affects hundreds of URLs, so one fix can lift them all. If a template shows poor scores, our guide to diagnosing a slow custom web app walks through the bottlenecks to check first.
With metrics chosen, build the dashboard itself. The aim is a view that shows Core Web Vitals next to the business outcomes they affect.
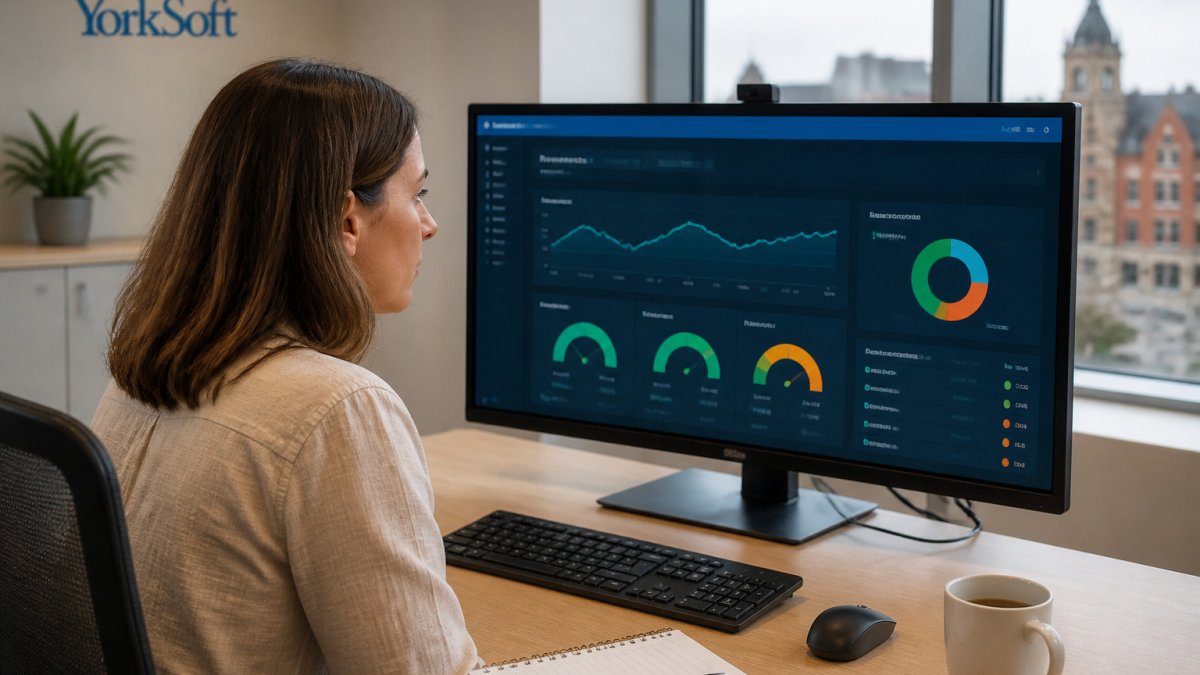
Follow this sequence:
Here is a useful test for the finished view: can a non-specialist see, within 30 seconds, whether the site is getting faster and whether that is helping the business? If not, simplify it.
Teams that tie technical fixes to engagement data can show clients and leaders what each change achieved.
Tools matter less than workflow, but the choice still affects how often the dashboard gets used. Many teams combine several sources, which is why consolidating data into one view is now standard practice.
Match tools to your team size and to the data you actually hold:
Separating the storage layer from the presentation layer is a sound approach.
The trade-off is real. Some practitioners warn that dashboards can simplify complex data too far and hide the nuance needed for deep technical troubleshooting. Keep raw reports available for the technical team, and use the dashboard for the overview.
Before you buy anything, check these against your own setup:
That last pair is where most buying decisions go wrong. If a dashboard ingests Analytics data that includes user identifiers, or joins SEO data to a CRM record, you are processing personal data.
Test how a tool handles an individual's data during the trial, not after rollout.
If a tool fails the connector, template and compliance checks, it will sit unused within a few months, or worse, it will be used and create a data-protection problem.
The table below sets out which reporting setup suits each team size, based on the options discussed in this section.
| Team type | Suitable setup | Key consideration |
|---|---|---|
| Small teams | Search Console, Analytics, spreadsheet | Fine for one site and one stakeholder |
| Growing teams | Dashboard tool pulling SEO, email and paid data | Scheduled refresh and row-level permissions |
| Agencies | White-labelled client dashboards | Separate data connections per client |
A dashboard you must remember to check is a dashboard that will be ignored. Automation turns it into an early warning system. A useful alert fires on a real regression rather than on normal variation, and the dashboard itself needs ongoing maintenance.
Set alerts for the events that cost you most traffic:
A common pattern is to alert on a change relative to a trailing baseline, for example, indexed pages down more than a set percentage against the previous 28-day average, rather than on an absolute number.
Route alerts to the person who can act on them, not to a shared inbox nobody watches. Give each alert a clear owner and a response time.
This is also where UK teams need to think about data protection. Alert payloads often include URLs, query strings and sometimes user identifiers pulled from Analytics.
Schedule a monthly review as well. Automated alerts catch sudden faults; the review catches slow decline. It should check whether the metrics still match your business outcomes from Step 1.
Finally, plan a maintenance cycle. This is the lifecycle work most guides skip.
Watch out: dashboards rarely fail loudly. They fail by showing a stale number from a broken connector that nobody notices for a quarter. Put a last-refresh timestamp on every chart and alert when it goes stale.
If you are based in Northampton or the surrounding area and want a dashboard that shows whether your technical SEO is paying off, with alerting, retention and data-protection controls built in, get in touch with YorkSoft Ltd to discuss your outcomes and the metrics that will prove them.
Measuring technical SEO well takes more than a template. It needs a dashboard built around your site, your data sources and the outcomes your business needs to prove. YorkSoft Ltd can support that work, combining technical SEO monitoring with custom web applications.
If you are based in Northampton or the surrounding area and want a dashboard that shows whether your technical SEO is paying off, get in touch with YorkSoft Ltd to discuss your outcomes and the metrics that will prove them. You can also read our technical SEO checklist for custom-coded websites before you start, or review our technical SEO strategies for 2026 to see how we approach current priorities.
A technical SEO dashboard should track indexation status, crawl errors, page experience signals such as Core Web Vitals, and organic traffic tied to business goals. Include organic conversion rate and Customer Acquisition Cost, since these are commonly treated as core SEO measures. Add Share of Model if you need to report visibility in AI-driven search results. Keep the list short enough that someone can act on each metric within a single review session.
Custom dashboards pull data directly from sources such as Google Search Console and analytics platforms, which removes the manual copying that introduces errors into spreadsheets. They also let you link specific technical fixes to engagement changes. Because the layout is built around your own KPIs, reports show the figures that matter rather than generic traffic totals.
Review indexation and crawl error figures weekly, since problems there can block pages from appearing in search. Check Core Web Vitals and organic conversion rates monthly to spot trends rather than daily noise. Audit the dashboard itself each quarter to confirm that data connections still work and that the metrics still match your business objectives.
The right choice depends on your team's skills, the data sources you need and your budget, which varies widely between providers. Many teams combine Google Search Console, Google Analytics and a visualisation tool with data connectors. YorkSoft can assess your current setup and recommend an approach. Contact the team for a quote, as pricing depends on the scope of the build.